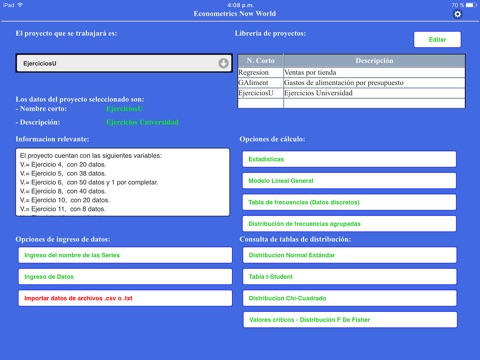
Make statistical calculations in the general linear model or set the mean, median and mode for the data analysis you are performing in your project or study.
The application is managed through activation by color. The options marked with green are ready for use, and those marked with red require a preliminary step to be active. The options marked with color other than green and red are normally used and are not critical.
Fields containing relevant information will be able to indicate what is necessary to activate a particular option or show information.
Each calculation project may have 15 variables and 1000 data, at the most, for each. Additionally, there are 15 fields that may be used to include the remnants of a model, if necessary.
Data entry may be carried out through the use of a keyboard or by import. Data import (name of variables and data for each case) may be used provided that there is no data entered into the project, and may be done in CSV and TXT file formats. The import requires previously granted permits for information storage services. The most commonly used separators are recognized in data import; however, their change may be requested if they have not been established as commonly used separators.
Calculation Options -
Statistics - It allows the display of basic statistics, as well as the behavior of selected variables on a chart.
General Linear Model - Assisted by the use of green and red colors, it will allow selecting the endogenous and exogenous variable of the model, as well its remnants, if applicable. Once the calculation option has been enabled, it shall be chosen to set the model data calculation and records.
It includes the option to record data resulting from a model for inclusion in another one, if necessary. The name with which the variable will be included and edited in data entry options shall be specified.
If required, the data produced and extracted from the model may be copied to a spreadsheet, provided that you tap a cell, click it and simply choose the option “Select All”, and then do the reverse process (copy) in the spreadsheet you have.
Charts may be enabled and, by default, the residual chart is always shown in XY Scatter Charts format. To disable variables in this option you must click one of the active variables listed in the chart Menu and include the one you want.
The confidence level of the Student’s t-distribution may vary, while F-distribution will remain at 95%.
Frequency Table (Discrete Data) - It is recommended, as stated in theory, that this option should be for a maximum of 12 levels. For more data, the use of Grouped Frequency Distribution is recommended.
Any calculation is performed by including the study variable.
The possibility to use frequency polygons with the corresponding histogram is shown in charts.
Grouped Frequency Distribution - The same opportunities as in the case of the Frequency Table (Discrete Data) are presented, except that the number of intervals to have is further required.
The number of intervals is suggested, if possible.
Distribution Table Query - It allows the display of Standard Normal, Student’s t, Chi-square and F-distribution tables. For ease of data reading you may click inside the table and the top and left ends will be marked and highlighted for a quick search.


